If you’ve been thinking -
-
My CPU’s usage is way below 50%. So CPU is definitely not the problem.
-
My memory consumption is also OK & there are no restarts. So it’s not a problem.
-
Is it about the other containers on the same host eating up my resources?
-
Is it my code ?
-
Is it throttling ? No, CPU usage is less, so it can’t be
tldr; It’s the CPU throttling, but it’s complicated. Throttling affects response time by huge degrees (x2 - x10), and it’s more common than we think.
A transaction which usually takes 80ms, could take cycle1{ (50ms[exec] + 50ms[throttled]) } + cycle2{ 30ms[exec] } === 130ms
The CPU gets throttled if the container sends out more instructions[cpu operations] to the CPU in the cpu period (typically 100ms). This typically happens when there are parallel threads running in a container. (= workers/unicorn workers in web application language) and less cores are allocated to the container.
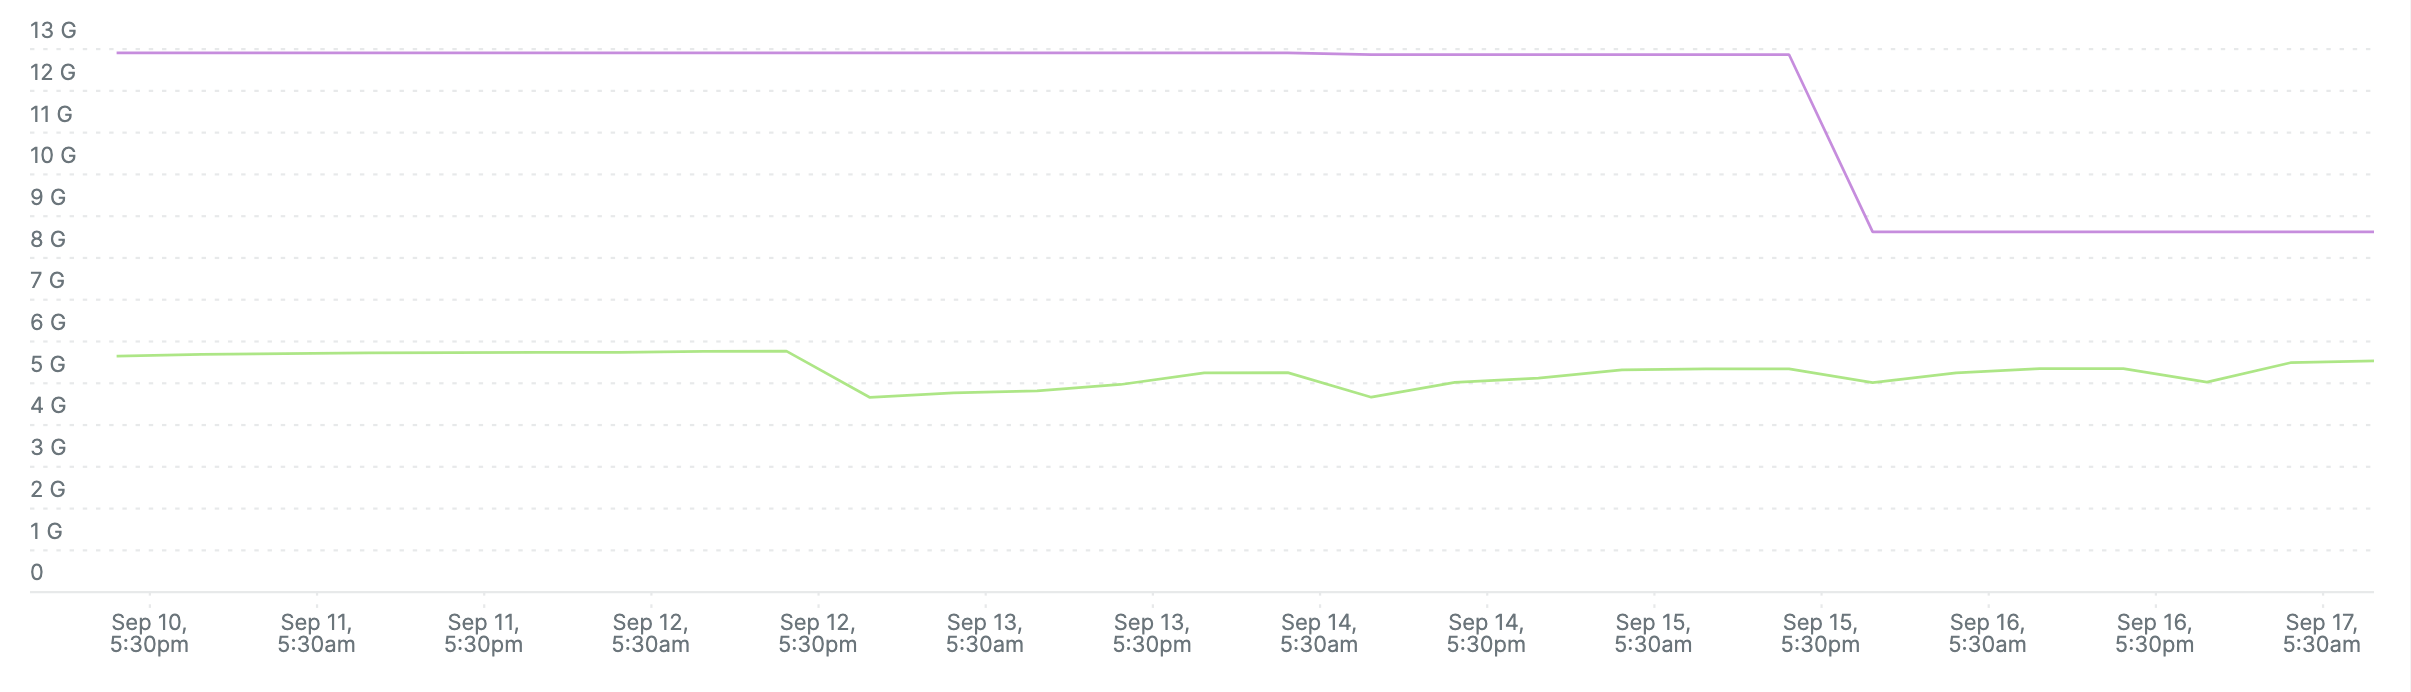
It’s very convenient to think that a “max CPU utilisation over time graph” like below, where the usage is always below the limit can never get throttled. Why would it ? Why should it ?
Well, here it is, getting throttled without giving a damn about CPU usage. (< allowed limit)
Why is it getting throttled ?
It’s getting throttled because it’s using more CPU than allowed per CPU period.
But the cpu graph shows usage is fine. How do you explain that ?
The CPU usage graph is an average over 7 days. Throttling is about “CPU Periods” (typically 100ms). If within 1 CPU period, more work is done than that allowed, the rest of the time of that cpu period (100 - x)ms the container gets throttled. (no work is done in that time)
I still don’t get it.
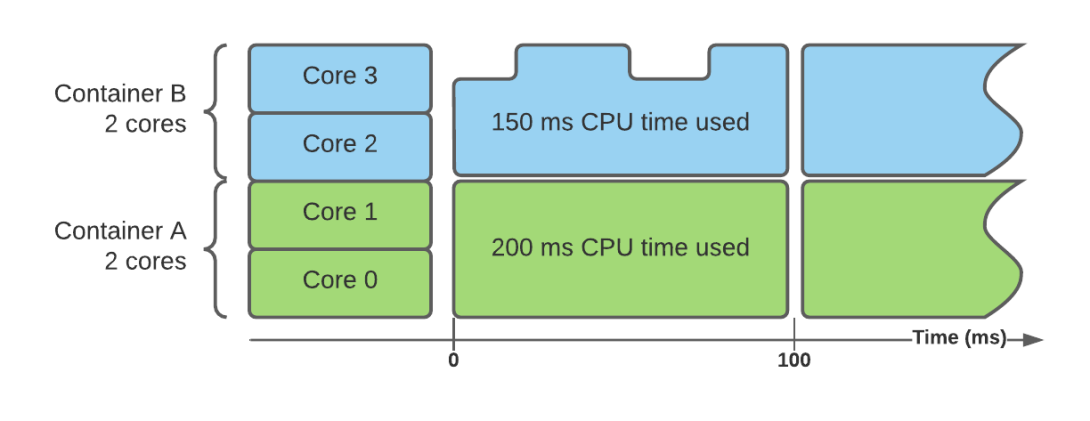
Simple example - Consider this application:
1 container
1 thread inside the container
Assume that the CPU capacity required to complete 1 request in 100ms is 1 Core. (x GHz)
So this container can serve 1 request in 100ms, provided a 1 core CPU. But If you instead run 8 threads on this container, with the same 1 core CPU, then this container will process all 8 threads simultaneously, and within the 100/8 = 12.5ms, it each thread would have done 1/8th of the work of it’s request. And at this point of time, the allowed CPU usage i.e. 1 core per 100ms is exhausted. Therefore, the container gets throttled for the rest of 87.5 ms!!
Therefore, the following parameters must be in sync with each other.
-
customer sla
-
work required for 1 thread’s single request processing(cpu core)[1]
-
volume of incoming requests
-
number of pods
-
number of cores allocated to container
-
number of threads running in container, processing requests in parallel.
[1] It’s possible for a 100ms sla request to require 2 core’s work to be done in 100ms, so you need 2 cores even for a single thread!
Analysis
Theory :: Number of cores >= number of workers/threads in a container to prevent throttling.
More rigorously,
c := k w
c: number of cores
k: integer, which depends on how many CPU operations are required for 1 app request.
w: number of workers
ECS vs EKS
We compared ECS and EKS response times and realized ECS didn't have throttling because of no hard limits on CPU! Here are some numbers -
ECS Average Response Time - 143ms
No hard limits on CPU usage - Prevents throttling.
UNICORN_WORKER_PROCESSES = w = 8
Container Count: 5
cpu = c = 6
resources: limits: cpu(c): 6400m memory: 12244Mi requests: cpu: 5120m memory: 9795Mi
After Migration To EKS
EKS Response Time - 200ms
replicaCount: 3
UNICORN_WORKER_PROCESSES: 8
resources: limits: cpu: 6400m memory: 12244Mi requests: cpu: 5120m memory: 9795Mi
Even the CPU usage was well within limits.
After Throttling Analysis
8 processed were running but around 5-6 cpu cores were allocated.
c = k w = 8k = 8 (k = 1 in this case. We know this from data that 1 core can process 1 request in 1 cpu period)
This is fine as we do have 8 core machines in our node groups. Memory analysis is based on
Peak < 8Gi
New Setting
resources: limits: cpu: '8' memory: 8Gi requests: cpu: '8' memory: 8Gi
Results ::
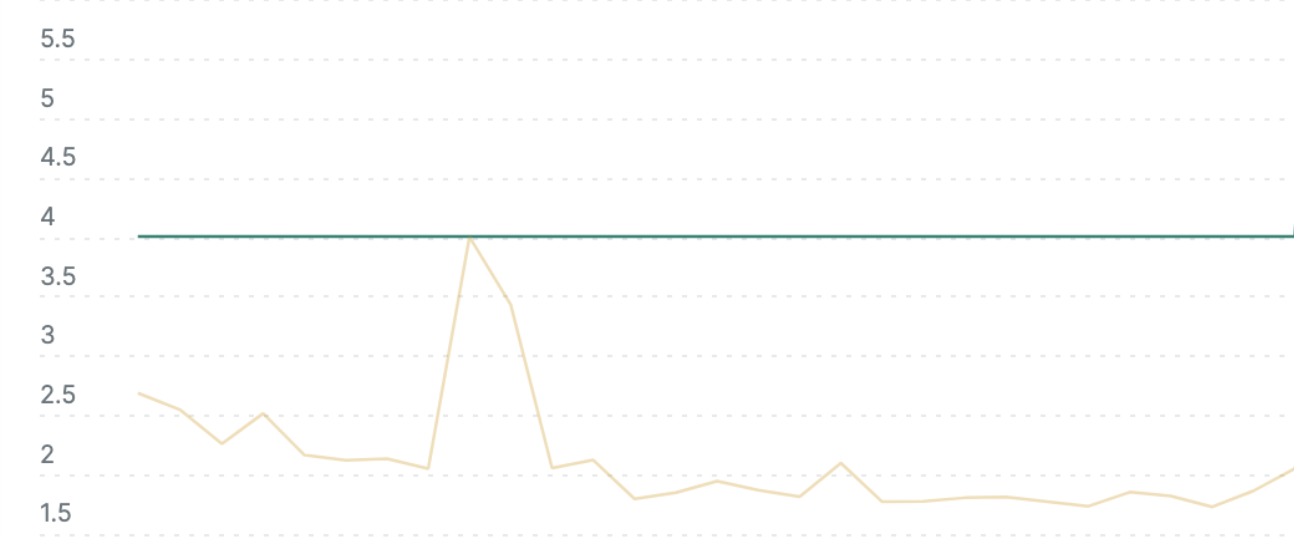
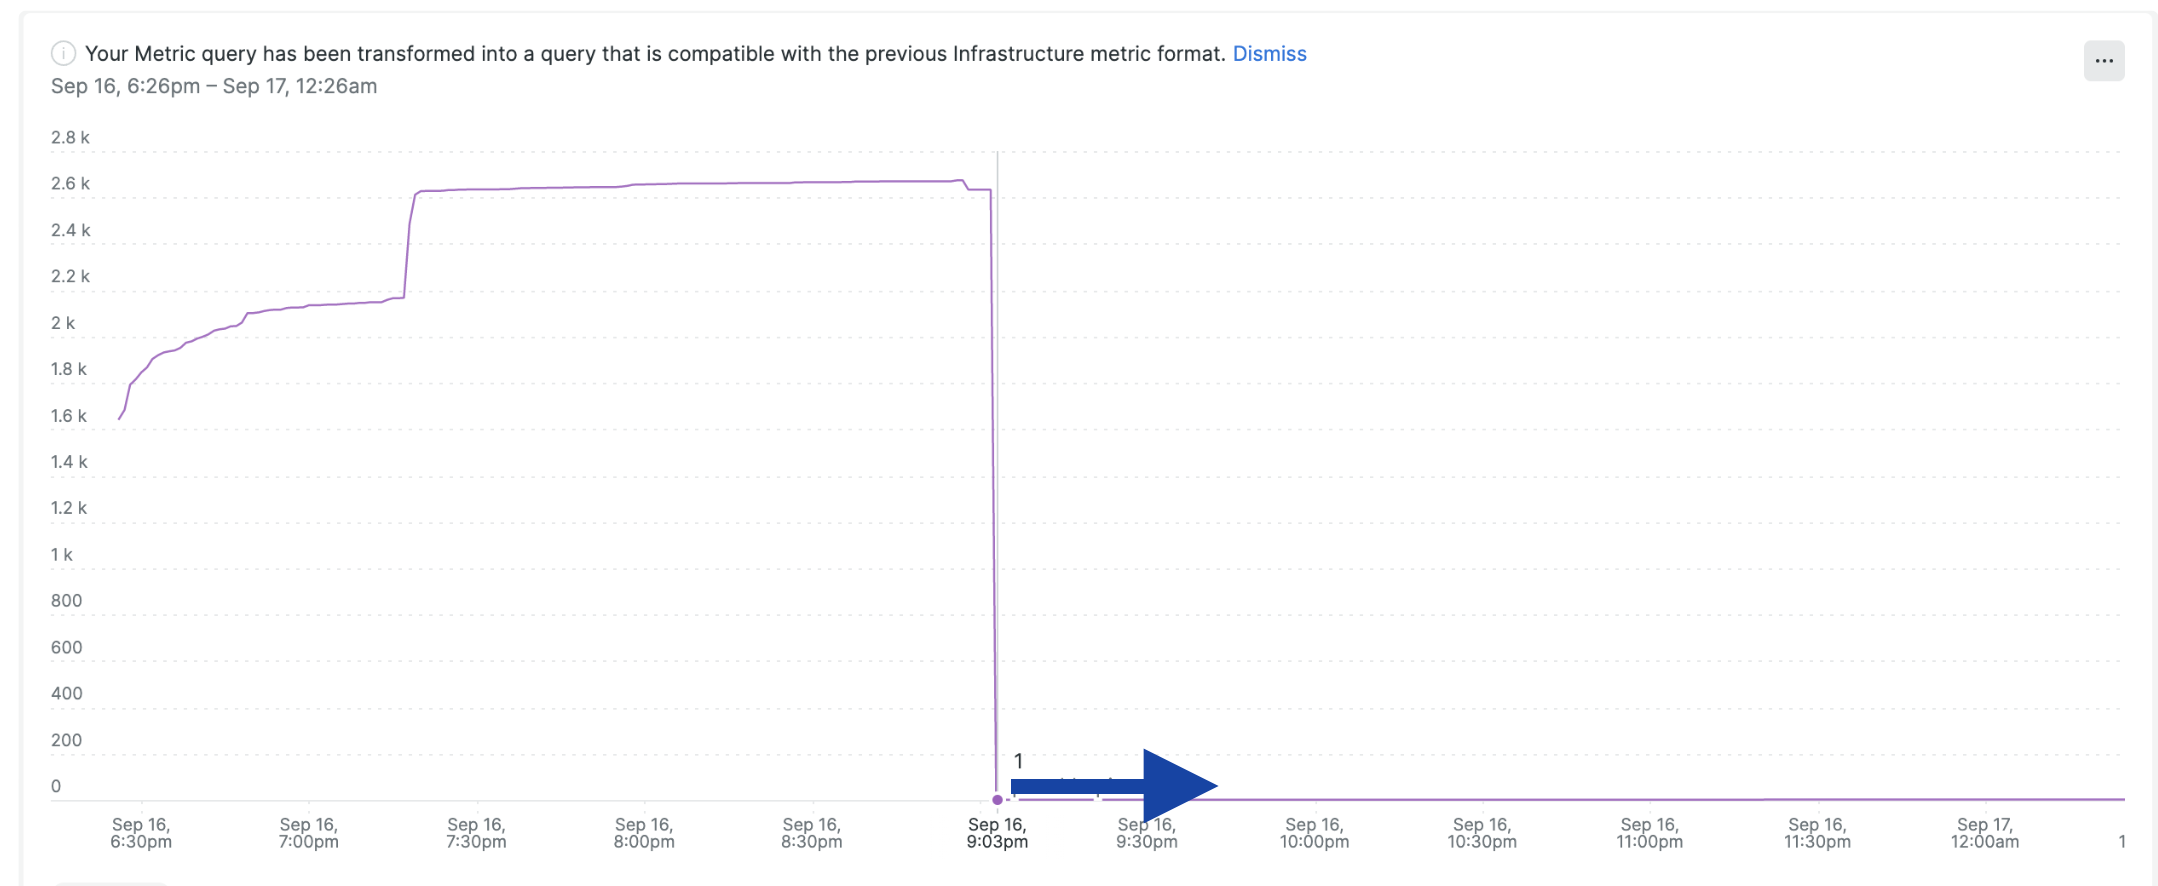
Graph A. Throttling Period Total - Throttling reduced down to 0.
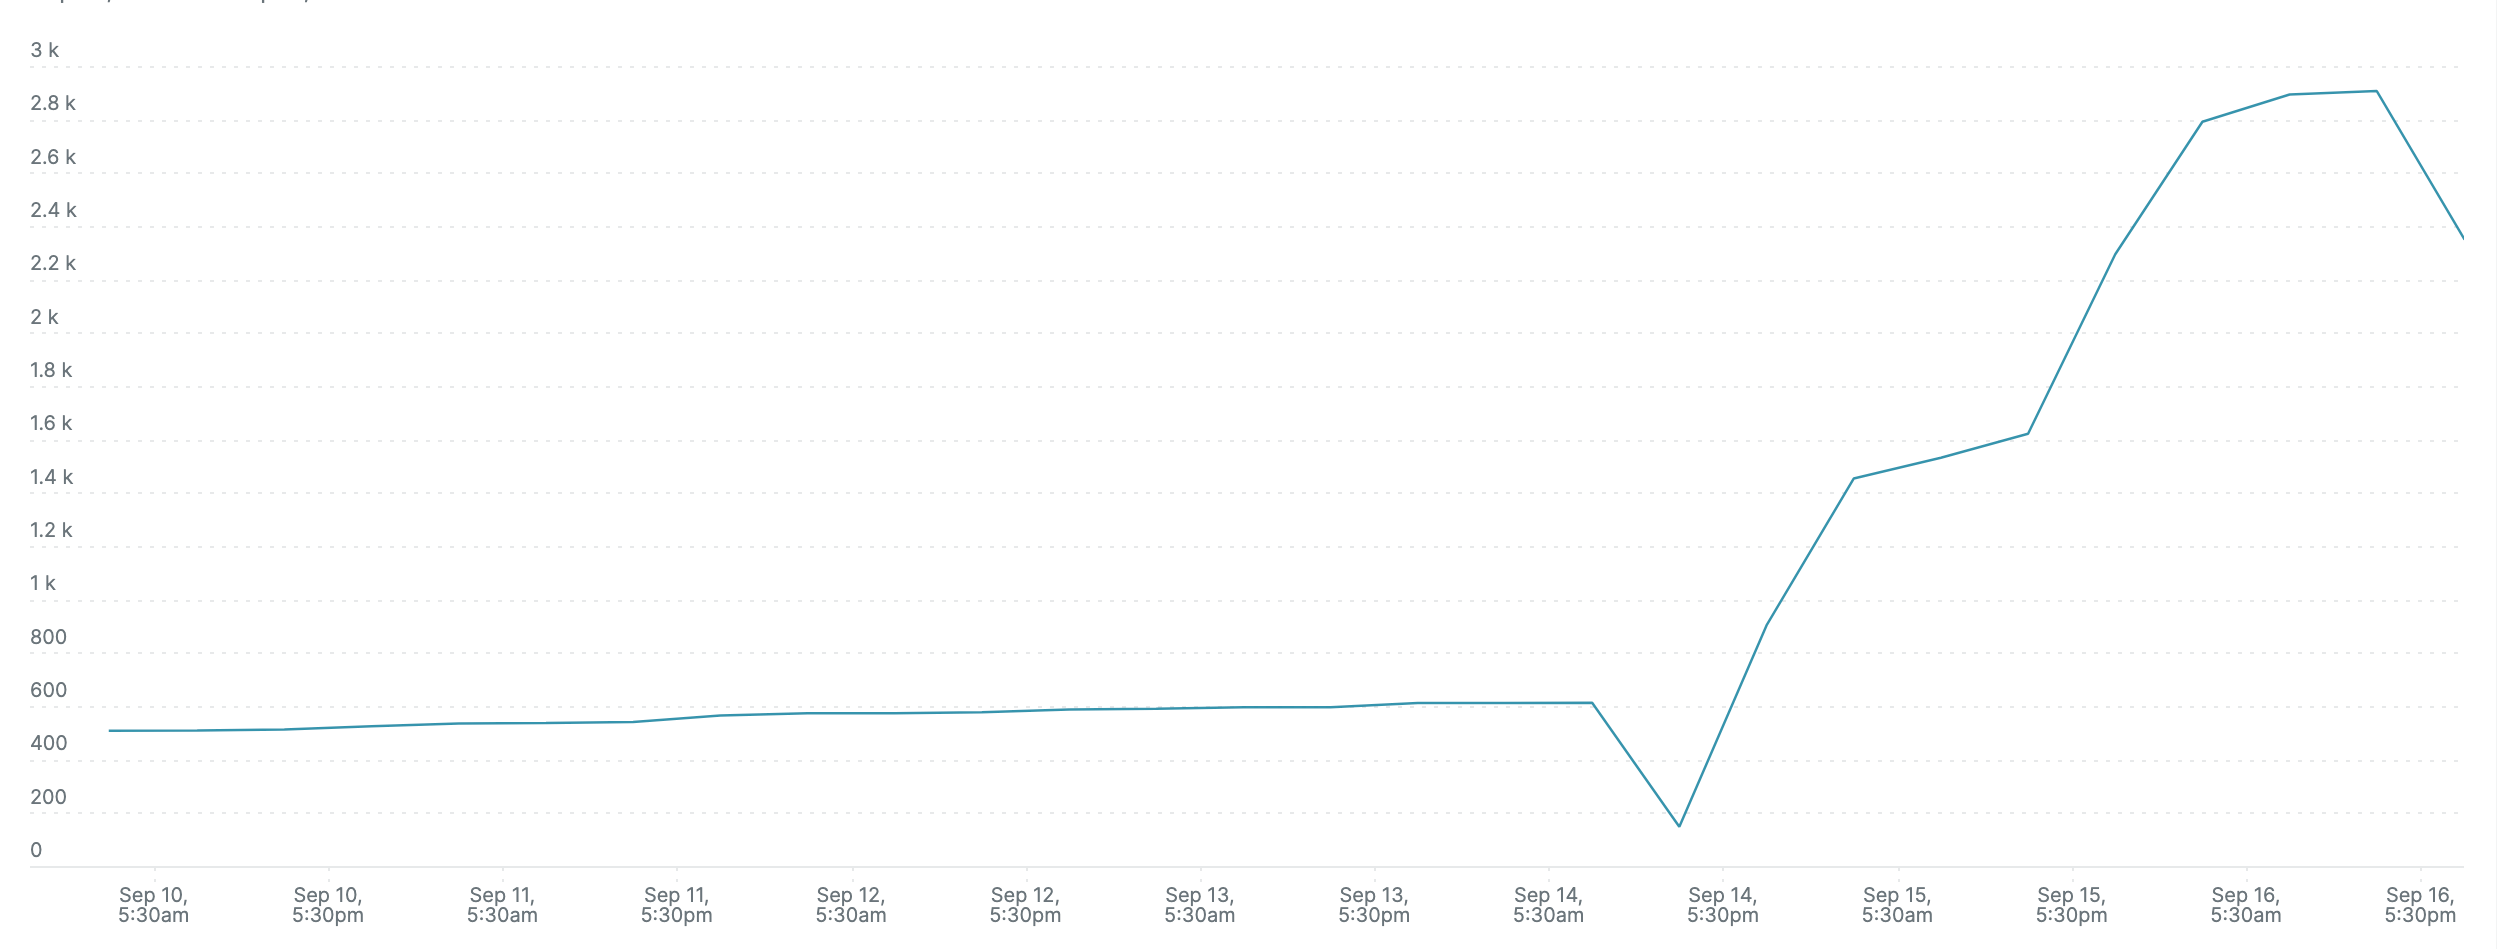
Graph B. Response time - goes down by 100%

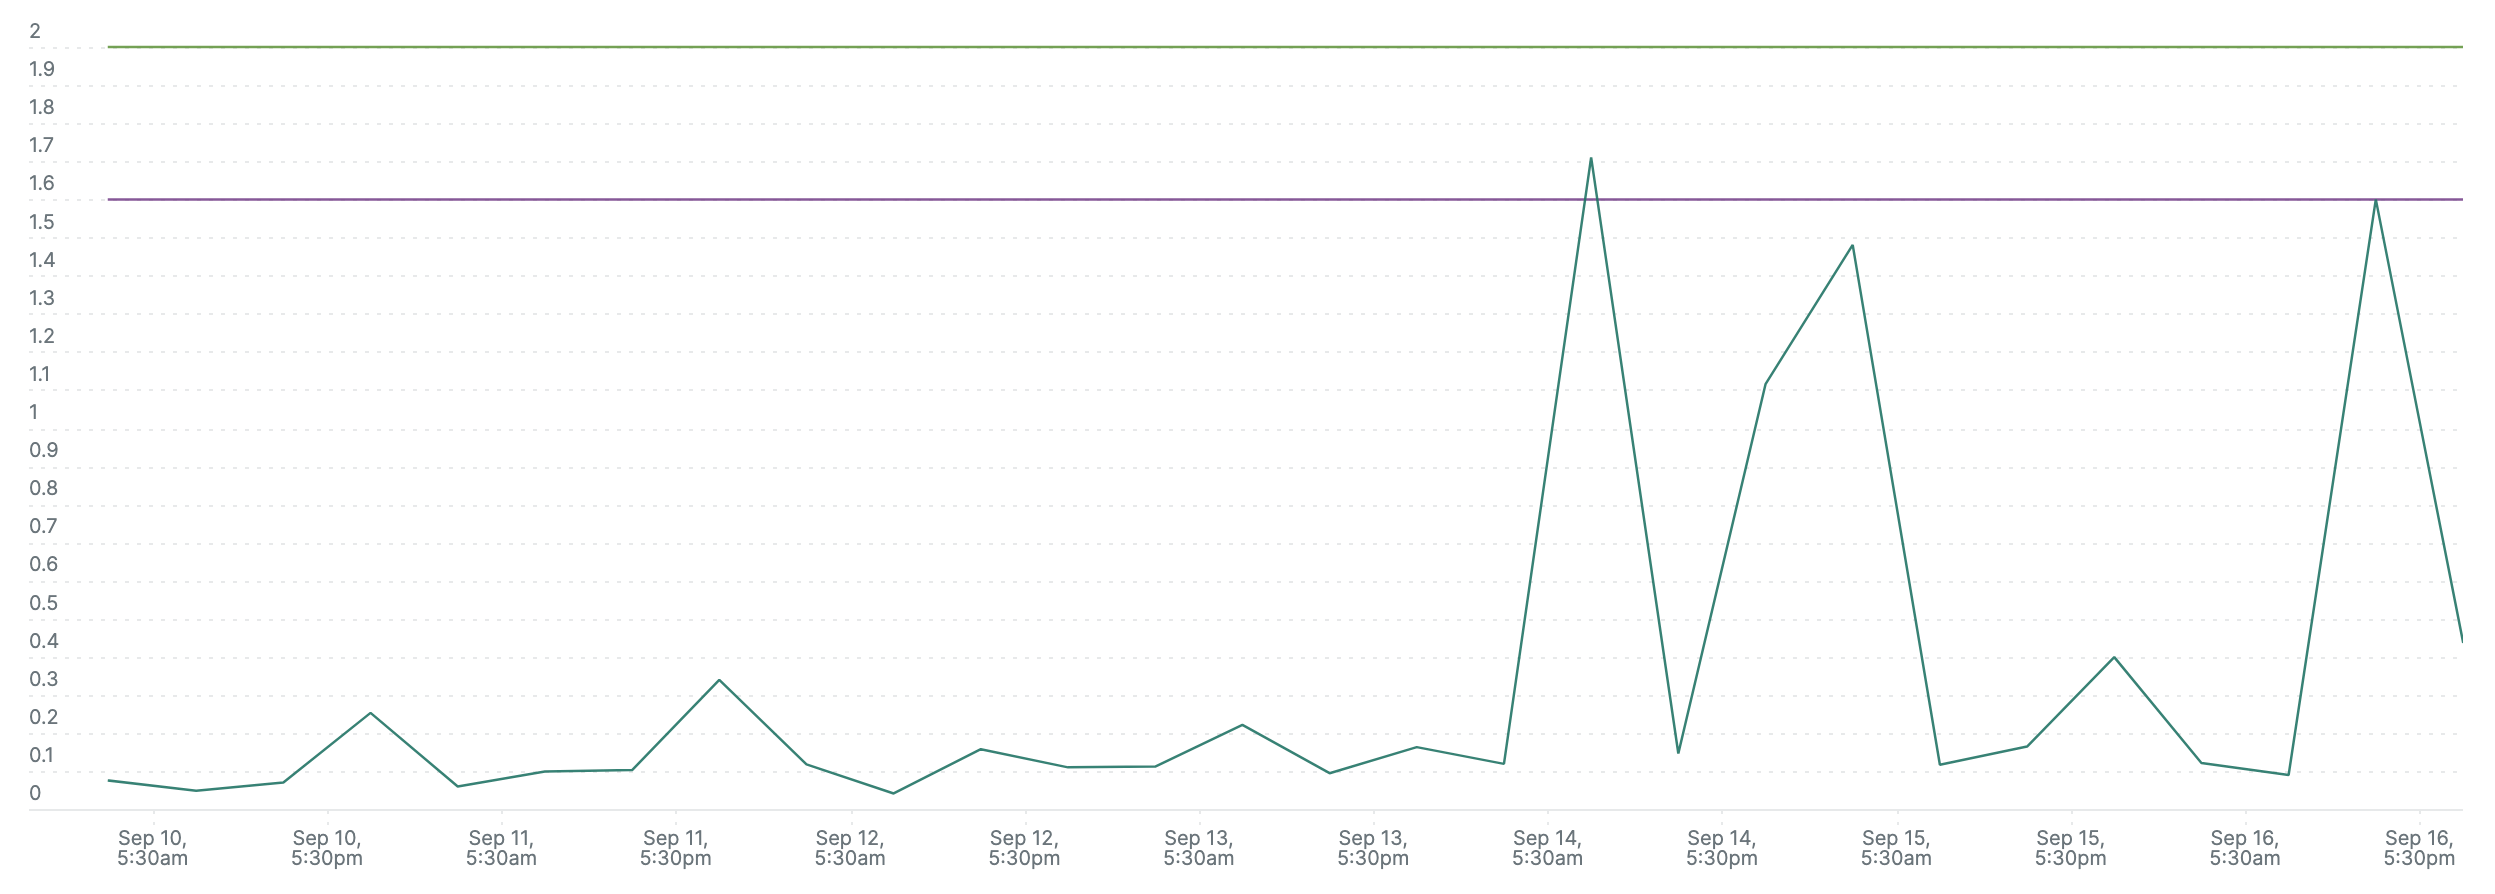
Graph C. Changes in CPU allocated which helped improve response time. Notice how cpu is within limit even during the first half in increased response time. The idea is that it’s not right to look at this graph to determine throttling, rather use the metric below (cpu cfs throttle period total) for the same. It gives a binary result as to whether a container is getting throttled or not.
Extra - Defeating throttling by optimising CPU as per threads, sla, workload & pod#.
OK, but I want to delve deeper & need more clarity.
The CPU gets throttled if the container sends out more instructions[cpu operations] to the CPU in the cpu period (typically 100ms). This typically happens when there are parallel threads running in a container. (= workers/unicorn workers in web application language) and less cores are allocated to the container.
Throttling affects response time. A transaction which usually takes 80ms, could take cycle1{ (50ms[exec] + 50ms[throttled]) } + cycle2{ 30ms[exec] } === 130ms
OK, e.g. 1
Consider a container running 1 thread which takes 6 x 10⁹ (6 Billion) operations to perform a transaction, when it’s allocated 1 core. (clock speed = 3 GHz = 3 x 10⁹ )
1 core allocation means that in 1 period = 100ms, the maximum work which the container can perform is = what 1 core can do i.e. 3 Billion operations. So for 1 transaction, time taken will be 2 cpu cycles = 200ms
Now, if 2 threads run in the container & try to process 2 transactions in parallel, then here’s what happens
Total work to be done for 2 transactions = 2 x 6 x 109 = 12 x 109 operations.
Time 0ms: 2 threads start sending operations to CPU
Time 50ms: Each thread has sent 1.5 Billion operations to CPU
Time 50ms: Total work done = 1.5 Billion x 2 threads = 3 Billion operations
Time 50ms: Container enters throttled state because CPU quota is complete for this period.
Time 100ms: Container exits throttled state
Time 100ms: 2 threads resume their operations
Time 150ms: 2 threads complete another set of 3 Billion operations, 1.5 Billion each.
Time 150ms: Container again enters throttled state
Time 200ms: Container resumes work
..
..
..
(The pattern is that in 1 period, 3 Ghz operations are performed. Total time required = 12/3 = 4 periods ~ 400ms**)
..
Time 350ms: Containers complete their last set of instructions. Till this point, 12 Billion operations have been performed and the transactions are done.
Therefore, the usual transaction time of 200ms becomes 350ms because of throttling! Not 2, but each transaction (threads are parallel) took 350ms because of parallelism.
This was an example where 2 threads caused high transaction time because of insufficient allocated CPU.
e.g. 2
Throttling is also possible when there is a single thread. Consider the same example as above, except that we just have 1 thread this time and we allocate 0.5 cores to it i.e. it can perform at max 1.5 billion operations in 100ms.
Time 0ms: Container sends instructions to CPU.
Time 50ms: 1.5 Billion operations sent. Max allowed quota reached for this 100ms period. Total work done = 1.5 Billion operations
Time 50ms: Container enters throttled state
Time 100ms: Container exits throttled state, sends instructions
Time: 150ms: Container enters throttled state, total operations done = 3 Billion operations
..
..
Time: 250ms: Container enters throttled state, total operations = 4.5 Billion
Time: 300ms: Container exits throttled state, sends instructions
Time 350ms: 1.5 Billion operations sent. Max allowed quota reached for this 100ms period. Container enters throttled state, total operations = 6 Billion
This time as well, it took 350ms for the 200ms job when there was a single thread.
SUMMARY
The most basic solution is to upgrade the CPU core count. That will fix the throttling 90% times. The idea is to keep the cpu core count in sync with the worker count of the container.
Another approach is to allocate the cores to containers exclusively - so regardless of whatever time spent, the core belongs to the container & therefore, there is no throttling. This was used by Uber. K8S supports exclusive core allocation via kubelet updates.
https://kubernetes.io/docs/tasks/administer-cluster/cpu-management-policies/
REFERENCES
By Uber - Quick, Clean & Crisp - https://www.uber.com/en-IN/blog/avoiding-cpu-throttling-in-a-containerized-environment/
Detailed Analysis -
Part 1 - https://engineering.indeedblog.com/blog/2019/12/unthrottled-fixing-cpu-limits-in-the-cloud/
Part 2 - https://engineering.indeedblog.com/blog/2019/12/cpu-throttling-regression-fix/
Kernel Level Cause - https://git.kernel.org/pub/scm/linux/kernel/git/torvalds/linux.git/commit/?id=512ac999
https://erickhun.com/posts/kubernetes-faster-services-no-cpu-limits/
The problem was fixed to a great extent in Linux Kernels 5.4+